DATA ANALYSIS AND DATA VISUALIZATION
ZSB Tech Solutions understand that today’s businesses face an overwhelming amount of data, making it difficult to extract meaningful insights. We have a team of experienced professionals who specialize in data analysis and visualization. Our team uses a range of cutting-edge tools and techniques to analyze and visualize complex data sets, providing valuable insights to help you make informed decisions. Whether you need help with data cleaning, statistical analysis, or visualization, our team has the skills and expertise to help you get the most out of your data.
Data Analysis
We understand the importance of data analysis in today’s world. Our team has experience in handling a vast range of data sets from different industries, including finance, healthcare, marketing, and more. We use cutting-edge tools and techniques to extract meaningful insights from your data, helping you make data-driven decisions. Our data analysis services include:
Data cleaning and preparation:
Data cleaning and preparation is an essential process for accurate and reliable data analysis. Our team uses a range of techniques and tools to clean and preprocess your data, including data wrangling, data imputation, and outlier detection. We ensure that your data is in the best possible shape before analysis.
Descriptive and inferential statistical analysis:
We are proficient in a range of statistical analysis techniques, including descriptive statistics, hypothesis testing, and regression analysis. We use these techniques to analyze your data and extract meaningful insights that help you understand the trends and patterns in your data.
Predictive modeling and machine learning:
Predictive modeling and machine learning are powerful techniques for forecasting future trends and patterns in your data. We are experienced in developing predictive models and machine learning algorithms that can help you make accurate predictions about future events, such as sales forecasting or customer churn prediction.
Text mining and sentiment analysis:
Text mining and sentiment analysis are useful techniques for analyzing large volumes of text data, such as customer reviews, social media posts, and survey responses. Our team uses natural language processing and machine learning techniques to extract insights from your text data and determine the sentiment and opinions of your customers.
Time-series analysis:
Time-series analysis is a powerful technique for analyzing time-dependent data, such as stock prices, weather data, or sales data. Our team is proficient in a range of time-series analysis techniques, including time-series forecasting, seasonality analysis, and trend analysis.
Data Visualization
Data visualization is a powerful tool for communicating complex information in a simple and intuitive way. Our team is experienced in creating a range of visualizations, including interactive dashboards, geographic maps, and infographics, that can help you understand your data better and make informed decisions. We use industry-standard visualization tools and techniques to create compelling visuals that can communicate complex information effectively. Our data visualization services include:
Dashboard creation:
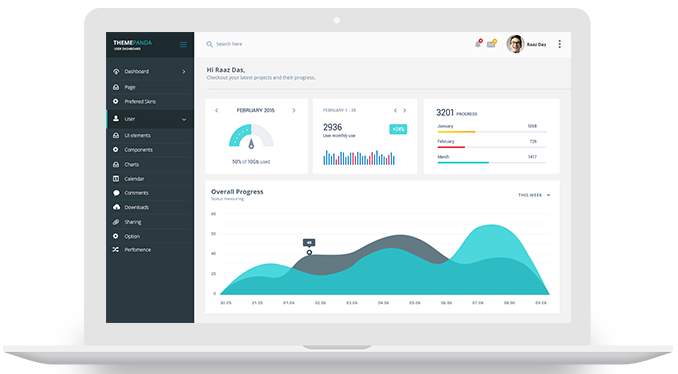
Our team can create custom dashboards that provide a comprehensive overview of your data. We use interactive visualizations and charts to display key metrics and KPIs in a single view. Our dashboards are designed to be user-friendly and can be customized to suit your specific needs.
Interactive visualizations:
Interactive visualizations are an excellent way to engage with your data and explore it in more detail. We can create interactive visualizations that allow you to filter and explore your data in real-time. We use a range of tools and techniques to create dynamic and engaging visualizations that provide valuable insights.
Geographic mapping:
Geographic mapping is a useful tool for visualizing data that has a geographical component. Our team can create custom maps that display your data in a visually appealing way. We use a range of mapping tools and techniques to create maps that provide valuable insights into your data.
Infographics:
Infographics are an excellent way to communicate complex information in a simple and visually appealing way. Our team can create custom infographics that convey your key messages in a clear and concise manner. We use a range of design tools and techniques to create infographics that are both informative and visually appealing.
Storytelling with data:
Storytelling with data is an art that involves presenting your data in a way that tells a compelling story. Our team can help you tell your data story by creating custom visualizations that highlight the key insights and trends in your data. We use a range of storytelling techniques to create data narratives that engage and inform your audience.
Why Choose Us?
We understand that data analysis and visualization can be a daunting task for many businesses. That’s why we are here to help. We have the necessary expertise and experience to handle your data with care and precision, ensuring that you get the insights you need to make informed decisions.
Here are some reasons why you should choose ZSB Tech Solutions for your data analysis and visualization needs:
- Experienced and skilled team of data analysts and visualization experts
- Customized solutions tailored to your unique needs
- Quick turnaround time and flexible engagement models
- Affordable pricing with no compromise on quality
- Confidentiality and security of your data


